Index Trend Analysis Report
Prepared for you on Friday, April 26, 2024.
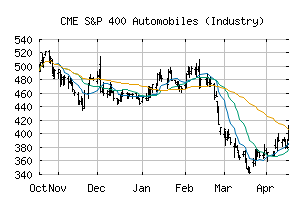
S&P 400 Automobiles (Industry) (CME:SP400-251020)
Long-Term Downtrend (-90) - SP400-251020 is in a strong downtrend that is likely to continue. While SP400-251020 is showing intraday strength, it remains in the confines of a bearish trend. Traders should use caution and set stops.
Is it time to buy, sell, or avoid SP400-251020?
MarketClub looks at technical strength and momentum to determine if the timing is right for SP400-251020.
Learn more about the Trade Triangles and how we make technical analysis as easy as buy and sell.
|
|||||||||||||||
|
|||||||||||||||
MarketClub’s Trade Triangles for SP400-251020
![]() The long-term trend has been DOWN since Apr 17th, 2024 at 553.49
The long-term trend has been DOWN since Apr 17th, 2024 at 553.49
![]() The intermediate-term trend has been DOWN since Mar 6th, 2024 at 582.25
The intermediate-term trend has been DOWN since Mar 6th, 2024 at 582.25
![]() The short-term trend has been DOWN since Apr 25th, 2024 at 555.08
The short-term trend has been DOWN since Apr 25th, 2024 at 555.08
Smart Scan Analysis for SP400-251020
Based on our trend formula, SP400-251020 is rated as a -90 on a scale from -100 (Strong Downtrend) to +100 (Strong Uptrend).
| Open | High | Low | Price | Change |
|---|---|---|---|---|
| 526.65 | 539.10 | 523.91 | 535.42 | +11.36 |
| Prev. Close | Volume | Bid | Ask | Time |
| 524.06 | 1630727 | 2024-04-26 12:52:50 |
| 52wk High | 696.82 | 52wk High Date | 2018-01-24 |
| 52wk Low | 274.14 | 52wk Low Date | 2018-10-29 |