Index Trend Analysis Report
Prepared for you on Friday, April 19, 2024.
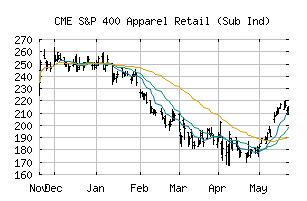
S&P 400 Apparel Retail (Sub Ind) (CME:SP400-25504010)
Strong Downtrend (-100) - SP400-25504010 is in a strong downtrend that is likely to continue. With short-term, intermediate, and long-term bearish momentum, SP400-25504010 continues to fall. Traders should use caution and set stops.
Is it time to buy, sell, or avoid SP400-25504010?
MarketClub looks at technical strength and momentum to determine if the timing is right for SP400-25504010.
Learn more about the Trade Triangles and how we make technical analysis as easy as buy and sell.
|
|||||||||||||||
|
|||||||||||||||
MarketClub’s Trade Triangles for SP400-25504010
![]() The long-term trend has been DOWN since Apr 16th, 2024 at 180.47
The long-term trend has been DOWN since Apr 16th, 2024 at 180.47
![]() The intermediate-term trend has been DOWN since Apr 5th, 2024 at 201.27
The intermediate-term trend has been DOWN since Apr 5th, 2024 at 201.27
![]() The short-term trend has been DOWN since Mar 26th, 2024 at 226.81
The short-term trend has been DOWN since Mar 26th, 2024 at 226.81
Smart Scan Analysis for SP400-25504010
Based on our trend formula, SP400-25504010 is rated as a -100 on a scale from -100 (Strong Downtrend) to +100 (Strong Uptrend).
| Open | High | Low | Price | Change |
|---|---|---|---|---|
| 180.13 | 181.21 | 177.33 | 178.06 | -0.85 |
| Prev. Close | Volume | Bid | Ask | Time |
| 178.06 | 6251660 | 2024-04-18 16:19:35 |
| 52wk High | 360.96 | 52wk High Date | 2018-08-22 |
| 52wk Low | 197.84 | 52wk Low Date | 2017-12-01 |