Index Trend Analysis Report
Prepared for you on Thursday, April 25, 2024.
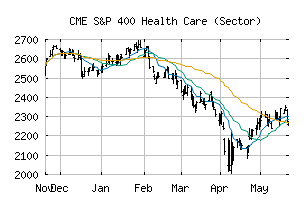
S&P 400 Health Care (Sector) (CME:SP400-35)
Sidelines Mode (+55) - SP400-35 is moving in a sideways pattern and is unable to gain momentum in either direction. Beware of choppy movement and consider a sidelines position until a stronger trend is identified.
Is it time to buy, sell, or avoid SP400-35?
MarketClub looks at technical strength and momentum to determine if the timing is right for SP400-35.
Learn more about the Trade Triangles and how we make technical analysis as easy as buy and sell.
|
|||||||||||||||
|
|||||||||||||||
MarketClub’s Trade Triangles for SP400-35
![]() The long-term trend has been UP since Jan 12th, 2024 at 2438.29
The long-term trend has been UP since Jan 12th, 2024 at 2438.29
![]() The intermediate-term trend has been DOWN since Apr 12th, 2024 at 2490.91
The intermediate-term trend has been DOWN since Apr 12th, 2024 at 2490.91
![]() The short-term trend has been UP since Apr 23rd, 2024 at 2412.88
The short-term trend has been UP since Apr 23rd, 2024 at 2412.88
Smart Scan Analysis for SP400-35
Based on our trend formula, SP400-35 is rated as a +55 on a scale from -100 (Strong Downtrend) to +100 (Strong Uptrend).
| Open | High | Low | Price | Change |
|---|---|---|---|---|
| 2441.50 | 2458.42 | 2432.23 | 2444.55 | -0.89 |
| Prev. Close | Volume | Bid | Ask | Time |
| 2444.55 | 35123072 | 2024-04-24 17:07:32 |
| 52wk High | 2133.25 | 52wk High Date | 2018-09-14 |
| 52wk Low | 1552.84 | 52wk Low Date | 2017-12-06 |