Index Trend Analysis Report
Prepared for you on Thursday, April 25, 2024.
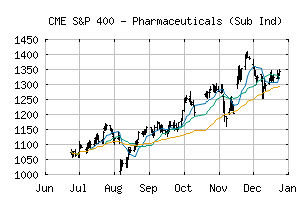
S&P 400 - Pharmaceuticals (Sub Ind) (CME:SP400-35202010)
Bear Market Rally (-75) - SP400-35202010 is showing some rallying power, but still remains in the confines of a long-term downtrend. Keep an eye on SP400-35202010 as it may be in the beginning of a reversal.
Is it time to buy, sell, or avoid SP400-35202010?
MarketClub looks at technical strength and momentum to determine if the timing is right for SP400-35202010.
Learn more about the Trade Triangles and how we make technical analysis as easy as buy and sell.
|
|||||||||||||||
|
|||||||||||||||
MarketClub’s Trade Triangles for SP400-35202010
![]() The long-term trend has been DOWN since Feb 29th, 2024 at 1139.54
The long-term trend has been DOWN since Feb 29th, 2024 at 1139.54
![]() The intermediate-term trend has been DOWN since Feb 28th, 2024 at 1224.33
The intermediate-term trend has been DOWN since Feb 28th, 2024 at 1224.33
![]() The short-term trend has been UP since Apr 25th, 2024 at 1149.75
The short-term trend has been UP since Apr 25th, 2024 at 1149.75
Smart Scan Analysis for SP400-35202010
Based on our trend formula, SP400-35202010 is rated as a -75 on a scale from -100 (Strong Downtrend) to +100 (Strong Uptrend).
| Open | High | Low | Price | Change |
|---|---|---|---|---|
| 1135.25 | 1153.04 | 1130.92 | 1141.62 | +3.26 |
| Prev. Close | Volume | Bid | Ask | Time |
| 1138.36 | 585125 | 2024-04-25 12:13:20 |
| 52wk High | 1546.07 | 52wk High Date | 2018-01-26 |
| 52wk Low | 1017.02 | 52wk Low Date | 2018-05-03 |