Index Trend Analysis Report
Prepared for you on Saturday, April 20, 2024.
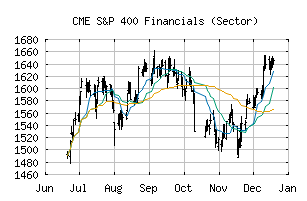
S&P 400 Financials (Sector) (CME:SP400-40)
Sidelines Mode (+55) - SP400-40 is moving in a sideways pattern and is unable to gain momentum in either direction. Beware of choppy movement and consider a sidelines position until a stronger trend is identified.
Is it time to buy, sell, or avoid SP400-40?
MarketClub looks at technical strength and momentum to determine if the timing is right for SP400-40.
Learn more about the Trade Triangles and how we make technical analysis as easy as buy and sell.
|
|||||||||||||||
|
|||||||||||||||
MarketClub’s Trade Triangles for SP400-40
![]() The long-term trend has been UP since Dec 1st, 2023 at 1165.12
The long-term trend has been UP since Dec 1st, 2023 at 1165.12
![]() The intermediate-term trend has been DOWN since Apr 10th, 2024 at 1290.25
The intermediate-term trend has been DOWN since Apr 10th, 2024 at 1290.25
![]() The short-term trend has been UP since Apr 19th, 2024 at 1264.60
The short-term trend has been UP since Apr 19th, 2024 at 1264.60
Smart Scan Analysis for SP400-40
Based on our trend formula, SP400-40 is rated as a +55 on a scale from -100 (Strong Downtrend) to +100 (Strong Uptrend).
| Open | High | Low | Price | Change |
|---|---|---|---|---|
| 1258.82 | 1279.82 | 1258.49 | 1279.53 | +21.30 |
| Prev. Close | Volume | Bid | Ask | Time |
| 1279.53 | 96452392 | 2024-04-19 16:20:04 |
| 52wk High | 1086.75 | 52wk High Date | 2018-03-13 |
| 52wk Low | 869.45 | 52wk Low Date | 2018-10-24 |