Index Trend Analysis Report
Prepared for you on Thursday, April 18, 2024.
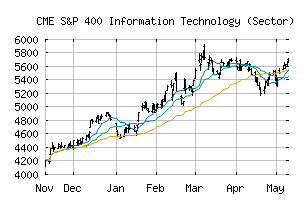
S&P 400 Information Technology (Sector) (CME:SP400-45)
Weak Downtrend (-65) - SP400-45 is showing signs of a strengthening downtrend. Monitor SP400-45 as it may be building momentum to the downside.
Is it time to buy, sell, or avoid SP400-45?
MarketClub looks at technical strength and momentum to determine if the timing is right for SP400-45.
Learn more about the Trade Triangles and how we make technical analysis as easy as buy and sell.
|
|||||||||||||||
|
|||||||||||||||
MarketClub’s Trade Triangles for SP400-45
![]() The long-term trend has been UP since Dec 14th, 2023 at 4657.62
The long-term trend has been UP since Dec 14th, 2023 at 4657.62
![]() The intermediate-term trend has been DOWN since Apr 15th, 2024 at 5464.50
The intermediate-term trend has been DOWN since Apr 15th, 2024 at 5464.50
![]() The short-term trend has been DOWN since Apr 2nd, 2024 at 5605.00
The short-term trend has been DOWN since Apr 2nd, 2024 at 5605.00
Smart Scan Analysis for SP400-45
Based on our trend formula, SP400-45 is rated as a -70 on a scale from -100 (Strong Downtrend) to +100 (Strong Uptrend).
| Open | High | Low | Price | Change |
|---|---|---|---|---|
| 5433.76 | 5440.49 | 5322.84 | 5323.18 | -87.49 |
| Prev. Close | Volume | Bid | Ask | Time |
| 5410.67 | 37254068 | 2024-04-17 16:19:29 |
| 52wk High | 2682.25 | 52wk High Date | 2018-09-14 |
| 52wk Low | 2189.49 | 52wk Low Date | 2018-02-09 |