Index Trend Analysis Report
Prepared for you on Thursday, April 25, 2024.
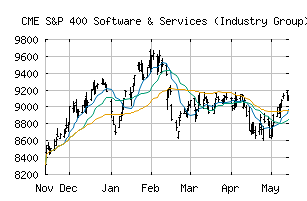
S&P 400 Software & Services (Industry Group) (CME:SP400-4510)
Countertrend Down (-85) - SP400-4510 is showing short-term strength. However, look for the longer-term bearish trend to resume. As always, continue to monitor the trend score and set stops.
Is it time to buy, sell, or avoid SP400-4510?
MarketClub looks at technical strength and momentum to determine if the timing is right for SP400-4510.
Learn more about the Trade Triangles and how we make technical analysis as easy as buy and sell.
|
|||||||||||||||
|
|||||||||||||||
MarketClub’s Trade Triangles for SP400-4510
![]() The long-term trend has been DOWN since Apr 19th, 2024 at 8631.60
The long-term trend has been DOWN since Apr 19th, 2024 at 8631.60
![]() The intermediate-term trend has been DOWN since Apr 12th, 2024 at 8918.64
The intermediate-term trend has been DOWN since Apr 12th, 2024 at 8918.64
![]() The short-term trend has been UP since Apr 23rd, 2024 at 8820.91
The short-term trend has been UP since Apr 23rd, 2024 at 8820.91
Smart Scan Analysis for SP400-4510
Based on our trend formula, SP400-4510 is rated as a -85 on a scale from -100 (Strong Downtrend) to +100 (Strong Uptrend).
| Open | High | Low | Price | Change |
|---|---|---|---|---|
| 8735.37 | 8808.85 | 8679.00 | 8735.73 | -136.07 |
| Prev. Close | Volume | Bid | Ask | Time |
| 8735.73 | 10337353 | 2024-04-24 17:07:32 |
| 52wk High | 5892.27 | 52wk High Date | 2018-09-14 |
| 52wk Low | 4449.4 | 52wk Low Date | 2017-12-01 |