Index Trend Analysis Report
Prepared for you on Thursday, April 25, 2024.
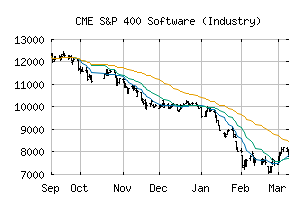
S&P 400 Software (Industry) (CME:SP400-451030)
Long-Term Downtrend (-90) - SP400-451030 is in a strong downtrend that is likely to continue. While SP400-451030 is showing intraday strength, it remains in the confines of a bearish trend. Traders should use caution and set stops.
Is it time to buy, sell, or avoid SP400-451030?
MarketClub looks at technical strength and momentum to determine if the timing is right for SP400-451030.
Learn more about the Trade Triangles and how we make technical analysis as easy as buy and sell.
|
|||||||||||||||
|
|||||||||||||||
MarketClub’s Trade Triangles for SP400-451030
![]() The long-term trend has been DOWN since Apr 15th, 2024 at 10439.10
The long-term trend has been DOWN since Apr 15th, 2024 at 10439.10
![]() The intermediate-term trend has been DOWN since Feb 12th, 2024 at 11563.74
The intermediate-term trend has been DOWN since Feb 12th, 2024 at 11563.74
![]() The short-term trend has been DOWN since Apr 24th, 2024 at 10200.65
The short-term trend has been DOWN since Apr 24th, 2024 at 10200.65
Smart Scan Analysis for SP400-451030
Based on our trend formula, SP400-451030 is rated as a -90 on a scale from -100 (Strong Downtrend) to +100 (Strong Uptrend).
| Open | High | Low | Price | Change |
|---|---|---|---|---|
| 10137.23 | 10297.59 | 10116.41 | 10273.83 | +14.86 |
| Prev. Close | Volume | Bid | Ask | Time |
| 10258.97 | 7874149 | 2024-04-25 16:19:54 |
| 52wk High | 6314.28 | 52wk High Date | 2018-09-14 |
| 52wk Low | 4402.77 | 52wk Low Date | 2018-02-09 |