Index Trend Analysis Report
Prepared for you on Wednesday, April 24, 2024.
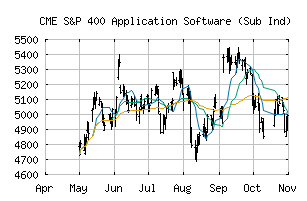
S&P 400 Application Software (Sub Ind) (CME:SP400-45103010)
Countertrend Down (-85) - SP400-45103010 is showing short-term strength. However, look for the longer-term bearish trend to resume. As always, continue to monitor the trend score and set stops.
Is it time to buy, sell, or avoid SP400-45103010?
MarketClub looks at technical strength and momentum to determine if the timing is right for SP400-45103010.
Learn more about the Trade Triangles and how we make technical analysis as easy as buy and sell.
|
|||||||||||||||
|
|||||||||||||||
MarketClub’s Trade Triangles for SP400-45103010
![]() The long-term trend has been DOWN since Apr 12th, 2024 at 4463.18
The long-term trend has been DOWN since Apr 12th, 2024 at 4463.18
![]() The intermediate-term trend has been DOWN since Feb 13th, 2024 at 4938.81
The intermediate-term trend has been DOWN since Feb 13th, 2024 at 4938.81
![]() The short-term trend has been UP since Apr 23rd, 2024 at 4408.90
The short-term trend has been UP since Apr 23rd, 2024 at 4408.90
Smart Scan Analysis for SP400-45103010
Based on our trend formula, SP400-45103010 is rated as a -85 on a scale from -100 (Strong Downtrend) to +100 (Strong Uptrend).
| Open | High | Low | Price | Change |
|---|---|---|---|---|
| 4266.13 | 4299.75 | 4266.13 | 4299.37 | -109.96 |
| Prev. Close | Volume | Bid | Ask | Time |
| 4409.33 | 91716 | 2024-04-24 09:31:35 |
| 52wk High | 2557.66 | 52wk High Date | 2018-09-14 |
| 52wk Low | 1860.17 | 52wk Low Date | 2017-12-01 |