Index Trend Analysis Report
Prepared for you on Thursday, April 18, 2024.
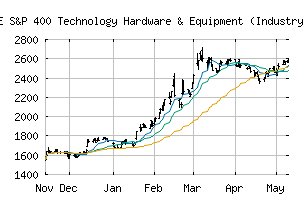
S&P 400 Technology Hardware & Equipment (Industry Group) (CME:SP400-4520)
Sidelines Mode (+55) - SP400-4520 is moving in a sideways pattern and is unable to gain momentum in either direction. Beware of choppy movement and consider a sidelines position until a stronger trend is identified.
Is it time to buy, sell, or avoid SP400-4520?
MarketClub looks at technical strength and momentum to determine if the timing is right for SP400-4520.
Learn more about the Trade Triangles and how we make technical analysis as easy as buy and sell.
|
|||||||||||||||
|
|||||||||||||||
MarketClub’s Trade Triangles for SP400-4520
![]() The long-term trend has been UP since Dec 14th, 2023 at 1745.63
The long-term trend has been UP since Dec 14th, 2023 at 1745.63
![]() The intermediate-term trend has been DOWN since Apr 15th, 2024 at 2456.32
The intermediate-term trend has been DOWN since Apr 15th, 2024 at 2456.32
![]() The short-term trend has been UP since Apr 4th, 2024 at 2590.99
The short-term trend has been UP since Apr 4th, 2024 at 2590.99
Smart Scan Analysis for SP400-4520
Based on our trend formula, SP400-4520 is rated as a +55 on a scale from -100 (Strong Downtrend) to +100 (Strong Uptrend).
| Open | High | Low | Price | Change |
|---|---|---|---|---|
| 2413.89 | 2425.17 | 2383.51 | 2393.41 | -20.63 |
| Prev. Close | Volume | Bid | Ask | Time |
| 2414.04 | 10528200 | 2024-04-18 16:19:39 |
| 52wk High | 1104.06 | 52wk High Date | 2018-01-19 |
| 52wk Low | 889.7 | 52wk Low Date | 2018-10-29 |