Index Trend Analysis Report
Prepared for you on Friday, April 19, 2024.
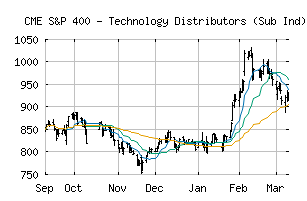
S&P 400 - Technology Distributors (Sub Ind) (CME:SP400-45203030)
Weak Uptrend (+65) - SP400-45203030 is showing signs of weakening momentum to the upside. Monitor SP400-45203030 as it may be in the beginning stages of a reversal.
Is it time to buy, sell, or avoid SP400-45203030?
MarketClub looks at technical strength and momentum to determine if the timing is right for SP400-45203030.
Learn more about the Trade Triangles and how we make technical analysis as easy as buy and sell.
|
|||||||||||||||
|
|||||||||||||||
MarketClub’s Trade Triangles for SP400-45203030
![]() The long-term trend has been UP since Mar 26th, 2024 at 727.39
The long-term trend has been UP since Mar 26th, 2024 at 727.39
![]() The intermediate-term trend has been UP since Feb 23rd, 2024 at 678.56
The intermediate-term trend has been UP since Feb 23rd, 2024 at 678.56
![]() The short-term trend has been DOWN since Apr 10th, 2024 at 737.77
The short-term trend has been DOWN since Apr 10th, 2024 at 737.77
Smart Scan Analysis for SP400-45203030
Based on our trend formula, SP400-45203030 is rated as a +65 on a scale from -100 (Strong Downtrend) to +100 (Strong Uptrend).
| Open | High | Low | Price | Change |
|---|---|---|---|---|
| 725.09 | 725.09 | 715.48 | 718.01 | -3.39 |
| Prev. Close | Volume | Bid | Ask | Time |
| 718.01 | 1474720 | 2024-04-18 16:19:35 |
| 52wk High | 406.85 | 52wk High Date | 2018-01-19 |
| 52wk Low | 289.31 | 52wk Low Date | 2018-10-29 |