Index Trend Analysis Report
Prepared for you on Thursday, April 18, 2024.
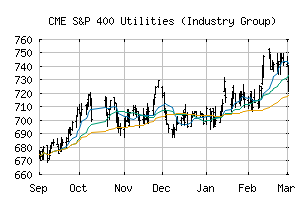
S&P 400 Utilities (Industry Group) (CME:SP400-5510)
Crossroads (-60) - SP400-5510 is struggling to move into a solid trend. Beware of choppy markets and consider a sidelines position until a stronger trend is identified.
Is it time to buy, sell, or avoid SP400-5510?
MarketClub looks at technical strength and momentum to determine if the timing is right for SP400-5510.
Learn more about the Trade Triangles and how we make technical analysis as easy as buy and sell.
|
|||||||||||||||
|
|||||||||||||||
MarketClub’s Trade Triangles for SP400-5510
![]() The long-term trend has been UP since Dec 13th, 2023 at 473.46
The long-term trend has been UP since Dec 13th, 2023 at 473.46
![]() The intermediate-term trend has been DOWN since Apr 15th, 2024 at 514.45
The intermediate-term trend has been DOWN since Apr 15th, 2024 at 514.45
![]() The short-term trend has been DOWN since Apr 4th, 2024 at 528.04
The short-term trend has been DOWN since Apr 4th, 2024 at 528.04
Smart Scan Analysis for SP400-5510
Based on our trend formula, SP400-5510 is rated as a -60 on a scale from -100 (Strong Downtrend) to +100 (Strong Uptrend).
| Open | High | Low | Price | Change |
|---|---|---|---|---|
| 515.91 | 516.52 | 513.60 | 515.39 | +1.68 |
| Prev. Close | Volume | Bid | Ask | Time |
| 513.71 | 1120192 | 2024-04-18 10:12:09 |
| 52wk High | 581.56 | 52wk High Date | 2018-11-20 |
| 52wk Low | 469.87 | 52wk Low Date | 2018-02-06 |