Index Trend Analysis Report
Prepared for you on Thursday, April 18, 2024.
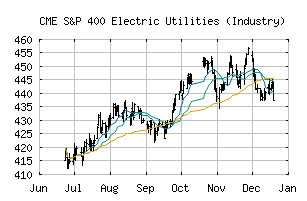
S&P 400 Electric Utilities (Industry) (CME:SP400-551010)
Long-Term Downtrend (-90) - SP400-551010 is in a strong downtrend that is likely to continue. While SP400-551010 is showing intraday strength, it remains in the confines of a bearish trend. Traders should use caution and set stops.
Is it time to buy, sell, or avoid SP400-551010?
MarketClub looks at technical strength and momentum to determine if the timing is right for SP400-551010.
Learn more about the Trade Triangles and how we make technical analysis as easy as buy and sell.
|
|||||||||||||||
|
|||||||||||||||
MarketClub’s Trade Triangles for SP400-551010
![]() The long-term trend has been DOWN since Feb 5th, 2024 at 328.35
The long-term trend has been DOWN since Feb 5th, 2024 at 328.35
![]() The intermediate-term trend has been DOWN since Apr 11th, 2024 at 331.55
The intermediate-term trend has been DOWN since Apr 11th, 2024 at 331.55
![]() The short-term trend has been DOWN since Apr 10th, 2024 at 334.27
The short-term trend has been DOWN since Apr 10th, 2024 at 334.27
Smart Scan Analysis for SP400-551010
Based on our trend formula, SP400-551010 is rated as a -90 on a scale from -100 (Strong Downtrend) to +100 (Strong Uptrend).
| Open | High | Low | Price | Change |
|---|---|---|---|---|
| 330.22 | 331.80 | 327.77 | 331.18 | +3.29 |
| Prev. Close | Volume | Bid | Ask | Time |
| 331.18 | 2936856 | 2024-04-17 16:19:35 |
| 52wk High | 440.5 | 52wk High Date | 2018-11-20 |
| 52wk Low | 346.25 | 52wk Low Date | 2018-02-06 |