Index Trend Analysis Report
Prepared for you on Friday, April 19, 2024.
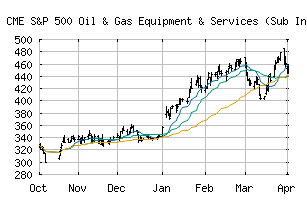
S&P 500 Oil & Gas Equipment & Services (Sub Ind) (CME:SP500-10101020)
Weak Downtrend (-65) - SP500-10101020 is showing signs of a strengthening downtrend. Monitor SP500-10101020 as it may be building momentum to the downside.
Is it time to buy, sell, or avoid SP500-10101020?
MarketClub looks at technical strength and momentum to determine if the timing is right for SP500-10101020.
Learn more about the Trade Triangles and how we make technical analysis as easy as buy and sell.
|
|||||||||||||||
|
|||||||||||||||
MarketClub’s Trade Triangles for SP500-10101020
![]() The long-term trend has been UP since Mar 21st, 2024 at 397.63
The long-term trend has been UP since Mar 21st, 2024 at 397.63
![]() The intermediate-term trend has been DOWN since Apr 15th, 2024 at 388.63
The intermediate-term trend has been DOWN since Apr 15th, 2024 at 388.63
![]() The short-term trend has been DOWN since Apr 10th, 2024 at 401.39
The short-term trend has been DOWN since Apr 10th, 2024 at 401.39
Smart Scan Analysis for SP500-10101020
Based on our trend formula, SP500-10101020 is rated as a -70 on a scale from -100 (Strong Downtrend) to +100 (Strong Uptrend).
| Open | High | Low | Price | Change |
|---|---|---|---|---|
| 380.15 | 385.62 | 378.95 | 380.16 | +2.48 |
| Prev. Close | Volume | Bid | Ask | Time |
| 377.68 | 20918248 | 2024-04-18 16:19:38 |
| 52wk High | 589.43 | 52wk High Date | 2018-01-23 |
| 52wk Low | 346.61 | 52wk Low Date | 2018-11-28 |