Index Trend Analysis Report
Prepared for you on Friday, April 19, 2024.
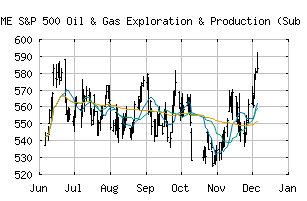
S&P 500 Oil & Gas Exploration & Production (Sub Ind) (CME:SP500-10102020)
Bull Market Weakness (+75) - SP500-10102020 is showing signs of short-term weakness, but still remains in the confines of a long-term uptrend. Keep an eye on SP500-10102020 as it may be in the beginning stages of a reversal.
Is it time to buy, sell, or avoid SP500-10102020?
MarketClub looks at technical strength and momentum to determine if the timing is right for SP500-10102020.
Learn more about the Trade Triangles and how we make technical analysis as easy as buy and sell.
|
|||||||||||||||
|
|||||||||||||||
MarketClub’s Trade Triangles for SP500-10102020
![]() The long-term trend has been UP since Mar 13th, 2024 at 635.34
The long-term trend has been UP since Mar 13th, 2024 at 635.34
![]() The intermediate-term trend has been UP since Feb 16th, 2024 at 607.08
The intermediate-term trend has been UP since Feb 16th, 2024 at 607.08
![]() The short-term trend has been UP since Apr 19th, 2024 at 693.45
The short-term trend has been UP since Apr 19th, 2024 at 693.45
Smart Scan Analysis for SP500-10102020
Based on our trend formula, SP500-10102020 is rated as a +70 on a scale from -100 (Strong Downtrend) to +100 (Strong Uptrend).
| Open | High | Low | Price | Change |
|---|---|---|---|---|
| 683.57 | 695.33 | 682.51 | 689.62 | +7.35 |
| Prev. Close | Volume | Bid | Ask | Time |
| 682.27 | 43488869 | 2024-04-19 16:20:08 |
| 52wk High | 514.43 | 52wk High Date | 2018-10-09 |
| 52wk Low | 376.22 | 52wk Low Date | 2018-02-09 |