Index Trend Analysis Report
Prepared for you on Wednesday, April 24, 2024.
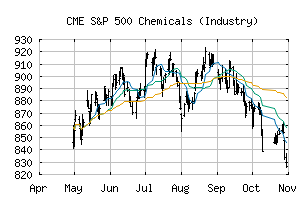
S&P 500 Chemicals (Industry) (CME:SP500-151010)
Crossroads (-60) - SP500-151010 is struggling to move into a solid trend. Beware of choppy markets and consider a sidelines position until a stronger trend is identified.
Is it time to buy, sell, or avoid SP500-151010?
MarketClub looks at technical strength and momentum to determine if the timing is right for SP500-151010.
Learn more about the Trade Triangles and how we make technical analysis as easy as buy and sell.
|
|||||||||||||||
|
|||||||||||||||
MarketClub’s Trade Triangles for SP500-151010
![]() The long-term trend has been UP since Dec 14th, 2023 at 868.99
The long-term trend has been UP since Dec 14th, 2023 at 868.99
![]() The intermediate-term trend has been DOWN since Apr 9th, 2024 at 924.84
The intermediate-term trend has been DOWN since Apr 9th, 2024 at 924.84
![]() The short-term trend has been DOWN since Apr 22nd, 2024 at 887.62
The short-term trend has been DOWN since Apr 22nd, 2024 at 887.62
Smart Scan Analysis for SP500-151010
Based on our trend formula, SP500-151010 is rated as a -60 on a scale from -100 (Strong Downtrend) to +100 (Strong Uptrend).
| Open | High | Low | Price | Change |
|---|---|---|---|---|
| 884.71 | 893.05 | 881.99 | 892.56 | +0.76 |
| Prev. Close | Volume | Bid | Ask | Time |
| 891.80 | 28077696 | 2024-04-24 17:07:32 |
| 52wk High | 664.66 | 52wk High Date | 2018-01-26 |
| 52wk Low | 541.58 | 52wk Low Date | 2018-10-26 |