Index Trend Analysis Report
Prepared for you on Thursday, April 25, 2024.
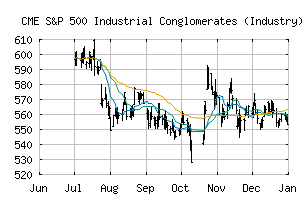
S&P 500 Industrial Conglomerates (Industry) (CME:SP500-201050)
Weak Downtrend (-65) - SP500-201050 is showing signs of a strengthening downtrend. Monitor SP500-201050 as it may be building momentum to the downside.
Is it time to buy, sell, or avoid SP500-201050?
MarketClub looks at technical strength and momentum to determine if the timing is right for SP500-201050.
Learn more about the Trade Triangles and how we make technical analysis as easy as buy and sell.
|
|||||||||||||||
|
|||||||||||||||
MarketClub’s Trade Triangles for SP500-201050
![]() The long-term trend has been UP since Nov 29th, 2023 at 373.53
The long-term trend has been UP since Nov 29th, 2023 at 373.53
![]() The intermediate-term trend has been DOWN since Apr 2nd, 2024 at 429.44
The intermediate-term trend has been DOWN since Apr 2nd, 2024 at 429.44
![]() The short-term trend has been DOWN since Apr 25th, 2024 at 439.22
The short-term trend has been DOWN since Apr 25th, 2024 at 439.22
Smart Scan Analysis for SP500-201050
Based on our trend formula, SP500-201050 is rated as a -70 on a scale from -100 (Strong Downtrend) to +100 (Strong Uptrend).
| Open | High | Low | Price | Change |
|---|---|---|---|---|
| 448.25 | 448.25 | 432.40 | 433.97 | -6.87 |
| Prev. Close | Volume | Bid | Ask | Time |
| 440.84 | 2912443 | 2024-04-25 12:11:23 |
| 52wk High | 397.22 | 52wk High Date | 2018-01-12 |
| 52wk Low | 277.93 | 52wk Low Date | 2018-11-26 |