Index Trend Analysis Report
Prepared for you on Tuesday, April 23, 2024.
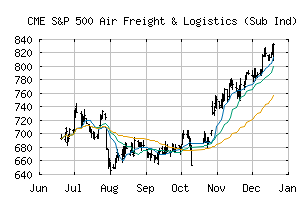
S&P 500 Air Freight & Logistics (Sub Ind) (CME:SP500-20301010)
Sidelines Mode (-55) - SP500-20301010 is moving in a sideways pattern and is unable to gain momentum in either direction. Beware of choppy movement and consider a sidelines position until a stronger trend is identified.
Is it time to buy, sell, or avoid SP500-20301010?
MarketClub looks at technical strength and momentum to determine if the timing is right for SP500-20301010.
Learn more about the Trade Triangles and how we make technical analysis as easy as buy and sell.
|
|||||||||||||||
|
|||||||||||||||
MarketClub’s Trade Triangles for SP500-20301010
![]() The long-term trend has been UP since Dec 15th, 2023 at 972.31
The long-term trend has been UP since Dec 15th, 2023 at 972.31
![]() The intermediate-term trend has been DOWN since Apr 12th, 2024 at 885.42
The intermediate-term trend has been DOWN since Apr 12th, 2024 at 885.42
![]() The short-term trend has been UP since Apr 19th, 2024 at 877.19
The short-term trend has been UP since Apr 19th, 2024 at 877.19
Smart Scan Analysis for SP500-20301010
Based on our trend formula, SP500-20301010 is rated as a -55 on a scale from -100 (Strong Downtrend) to +100 (Strong Uptrend).
| Open | High | Low | Price | Change |
|---|---|---|---|---|
| 876.05 | 888.16 | 871.89 | 883.47 | +11.36 |
| Prev. Close | Volume | Bid | Ask | Time |
| 883.47 | 8105744 | 2024-04-22 16:20:03 |
| 52wk High | 837.5 | 52wk High Date | 2018-01-18 |
| 52wk Low | 658.9 | 52wk Low Date | 2018-10-29 |