Index Trend Analysis Report
Prepared for you on Saturday, April 20, 2024.
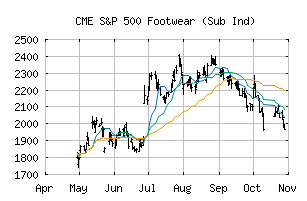
S&P 500 Footwear (Sub Ind) (CME:SP500-25203020)
Weak Downtrend (-65) - SP500-25203020 is showing signs of a strengthening downtrend. Monitor SP500-25203020 as it may be building momentum to the downside.
Is it time to buy, sell, or avoid SP500-25203020?
MarketClub looks at technical strength and momentum to determine if the timing is right for SP500-25203020.
Learn more about the Trade Triangles and how we make technical analysis as easy as buy and sell.
|
|||||||||||||||
|
|||||||||||||||
MarketClub’s Trade Triangles for SP500-25203020
![]() The long-term trend has been DOWN since Feb 2nd, 2024 at 3027.60
The long-term trend has been DOWN since Feb 2nd, 2024 at 3027.60
![]() The intermediate-term trend has been DOWN since Mar 4th, 2024 at 3087.12
The intermediate-term trend has been DOWN since Mar 4th, 2024 at 3087.12
![]() The short-term trend has been UP since Apr 11th, 2024 at 2785.07
The short-term trend has been UP since Apr 11th, 2024 at 2785.07
Smart Scan Analysis for SP500-25203020
Based on our trend formula, SP500-25203020 is rated as a -65 on a scale from -100 (Strong Downtrend) to +100 (Strong Uptrend).
| Open | High | Low | Price | Change |
|---|---|---|---|---|
| 2872.94 | 2882.89 | 2836.28 | 2836.90 | -37.75 |
| Prev. Close | Volume | Bid | Ask | Time |
| 2836.90 | 11689795 | 2024-04-19 16:20:08 |
| 52wk High | 2612.18 | 52wk High Date | 2018-09-21 |
| 52wk Low | 1801.38 | 52wk Low Date | 2017-12-01 |