Index Trend Analysis Report
Prepared for you on Friday, April 19, 2024.
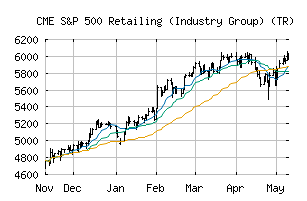
S&P 500 Retailing (Industry Group) (TR) (CME:SP500-2550TR)
Crossroads (-60) - SP500-2550TR is struggling to move into a solid trend. Beware of choppy markets and consider a sidelines position until a stronger trend is identified.
Is it time to buy, sell, or avoid SP500-2550TR?
MarketClub looks at technical strength and momentum to determine if the timing is right for SP500-2550TR.
Learn more about the Trade Triangles and how we make technical analysis as easy as buy and sell.
|
|||||||||||||||
|
|||||||||||||||
MarketClub’s Trade Triangles for SP500-2550TR
![]() The long-term trend has been UP since Dec 5th, 2023 at 4973.56
The long-term trend has been UP since Dec 5th, 2023 at 4973.56
![]() The intermediate-term trend has been DOWN since Apr 15th, 2024 at 5865.98
The intermediate-term trend has been DOWN since Apr 15th, 2024 at 5865.98
![]() The short-term trend has been DOWN since Apr 12th, 2024 at 5911.45
The short-term trend has been DOWN since Apr 12th, 2024 at 5911.45
Smart Scan Analysis for SP500-2550TR
Based on our trend formula, SP500-2550TR is rated as a -60 on a scale from -100 (Strong Downtrend) to +100 (Strong Uptrend).
| Open | High | Low | Price | Change |
|---|---|---|---|---|
| 5787.65 | 5837.62 | 5735.87 | 5751.25 | -36.40 |
| Prev. Close | Volume | Bid | Ask | Time |
| 5751.25 | 0 | 2024-04-18 16:19:35 |
| 52wk High | 3138.54 | 52wk High Date | 2018-10-01 |
| 52wk Low | 2101.9 | 52wk Low Date | 2017-12-01 |