Index Trend Analysis Report
Prepared for you on Friday, April 19, 2024.
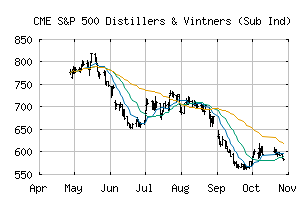
S&P 500 Distillers & Vintners (Sub Ind) (CME:SP500-30201020)
Crossroads (-60) - SP500-30201020 is struggling to move into a solid trend. Beware of choppy markets and consider a sidelines position until a stronger trend is identified.
Is it time to buy, sell, or avoid SP500-30201020?
MarketClub looks at technical strength and momentum to determine if the timing is right for SP500-30201020.
Learn more about the Trade Triangles and how we make technical analysis as easy as buy and sell.
|
|||||||||||||||
|
|||||||||||||||
MarketClub’s Trade Triangles for SP500-30201020
![]() The long-term trend has been UP since Jan 10th, 2024 at 1095.48
The long-term trend has been UP since Jan 10th, 2024 at 1095.48
![]() The intermediate-term trend has been DOWN since Apr 9th, 2024 at 1108.31
The intermediate-term trend has been DOWN since Apr 9th, 2024 at 1108.31
![]() The short-term trend has been DOWN since Apr 15th, 2024 at 1090.66
The short-term trend has been DOWN since Apr 15th, 2024 at 1090.66
Smart Scan Analysis for SP500-30201020
Based on our trend formula, SP500-30201020 is rated as a -60 on a scale from -100 (Strong Downtrend) to +100 (Strong Uptrend).
| Open | High | Low | Price | Change |
|---|---|---|---|---|
| 1090.22 | 1095.80 | 1089.69 | 1095.50 | +8.02 |
| Prev. Close | Volume | Bid | Ask | Time |
| 1087.48 | 260074 | 2024-04-19 10:10:23 |
| 52wk High | 1044.41 | 52wk High Date | 2018-04-30 |
| 52wk Low | 835.02 | 52wk Low Date | 2018-11-20 |