Index Trend Analysis Report
Prepared for you on Wednesday, April 24, 2024.
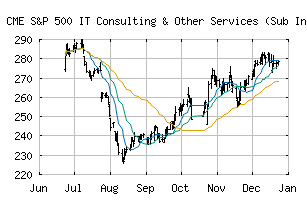
S&P 500 IT Consulting & Other Services (Sub Ind) (CME:SP500-45102010)
Sidelines Mode (-55) - SP500-45102010 is moving in a sideways pattern and is unable to gain momentum in either direction. Beware of choppy movement and consider a sidelines position until a stronger trend is identified.
Is it time to buy, sell, or avoid SP500-45102010?
MarketClub looks at technical strength and momentum to determine if the timing is right for SP500-45102010.
Learn more about the Trade Triangles and how we make technical analysis as easy as buy and sell.
|
|||||||||||||||
|
|||||||||||||||
MarketClub’s Trade Triangles for SP500-45102010
![]() The long-term trend has been UP since Nov 15th, 2023 at 224.12
The long-term trend has been UP since Nov 15th, 2023 at 224.12
![]() The intermediate-term trend has been DOWN since Mar 21st, 2024 at 263.69
The intermediate-term trend has been DOWN since Mar 21st, 2024 at 263.69
![]() The short-term trend has been UP since Apr 23rd, 2024 at 240.06
The short-term trend has been UP since Apr 23rd, 2024 at 240.06
Smart Scan Analysis for SP500-45102010
Based on our trend formula, SP500-45102010 is rated as a -55 on a scale from -100 (Strong Downtrend) to +100 (Strong Uptrend).
| Open | High | Low | Price | Change |
|---|---|---|---|---|
| 238.88 | 239.20 | 237.39 | 237.39 | -1.39 |
| Prev. Close | Volume | Bid | Ask | Time |
| 238.78 | 3045795 | 2024-04-24 11:08:53 |
| 52wk High | 184.64 | 52wk High Date | 2018-03-13 |
| 52wk Low | 148.99 | 52wk Low Date | 2018-10-30 |