Index Trend Analysis Report
Prepared for you on Tuesday, April 23, 2024.
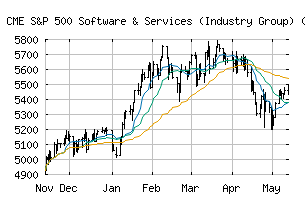
S&P 500 Software & Services (Industry Group) (TR) (CME:SP500-4510TR)
Crossroads (-60) - SP500-4510TR is struggling to move into a solid trend. Beware of choppy markets and consider a sidelines position until a stronger trend is identified.
Is it time to buy, sell, or avoid SP500-4510TR?
MarketClub looks at technical strength and momentum to determine if the timing is right for SP500-4510TR.
Learn more about the Trade Triangles and how we make technical analysis as easy as buy and sell.
|
|||||||||||||||
|
|||||||||||||||
MarketClub’s Trade Triangles for SP500-4510TR
![]() The long-term trend has been UP since Nov 3rd, 2023 at 4711.65
The long-term trend has been UP since Nov 3rd, 2023 at 4711.65
![]() The intermediate-term trend has been DOWN since Apr 12th, 2024 at 5575.23
The intermediate-term trend has been DOWN since Apr 12th, 2024 at 5575.23
![]() The short-term trend has been DOWN since Apr 2nd, 2024 at 5634.43
The short-term trend has been DOWN since Apr 2nd, 2024 at 5634.43
Smart Scan Analysis for SP500-4510TR
Based on our trend formula, SP500-4510TR is rated as a -60 on a scale from -100 (Strong Downtrend) to +100 (Strong Uptrend).
| Open | High | Low | Price | Change |
|---|---|---|---|---|
| 5338.78 | 5423.38 | 5338.78 | 5417.82 | +79.04 |
| Prev. Close | Volume | Bid | Ask | Time |
| 5338.78 | 0 | 2024-04-23 16:19:35 |
| 52wk High | 2231.14 | 52wk High Date | 2018-07-25 |
| 52wk Low | 1733.83 | 52wk Low Date | 2017-12-05 |