Index Trend Analysis Report
Prepared for you on Saturday, April 20, 2024.
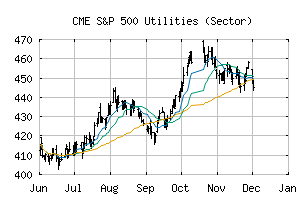
S&P 500 Utilities (Sector) (CME:SP500-55)
Weak Uptrend (+65) - SP500-55 is showing signs of weakening momentum to the upside. Monitor SP500-55 as it may be in the beginning stages of a reversal.
Is it time to buy, sell, or avoid SP500-55?
MarketClub looks at technical strength and momentum to determine if the timing is right for SP500-55.
Learn more about the Trade Triangles and how we make technical analysis as easy as buy and sell.
|
|||||||||||||||
|
|||||||||||||||
MarketClub’s Trade Triangles for SP500-55
![]() The long-term trend has been UP since Apr 4th, 2024 at 333.91
The long-term trend has been UP since Apr 4th, 2024 at 333.91
![]() The intermediate-term trend has been DOWN since Apr 15th, 2024 at 321.96
The intermediate-term trend has been DOWN since Apr 15th, 2024 at 321.96
![]() The short-term trend has been UP since Apr 19th, 2024 at 328.34
The short-term trend has been UP since Apr 19th, 2024 at 328.34
Smart Scan Analysis for SP500-55
Based on our trend formula, SP500-55 is rated as a +65 on a scale from -100 (Strong Downtrend) to +100 (Strong Uptrend).
| Open | High | Low | Price | Change |
|---|---|---|---|---|
| 328.27 | 332.92 | 327.69 | 332.18 | +4.81 |
| Prev. Close | Volume | Bid | Ask | Time |
| 332.18 | 117581335 | 2024-04-19 16:20:04 |
| 52wk High | 286.99 | 52wk High Date | 2017-12-01 |
| 52wk Low | 240.37 | 52wk Low Date | 2018-02-06 |