Index Trend Analysis Report
Prepared for you on Saturday, May 4, 2024.
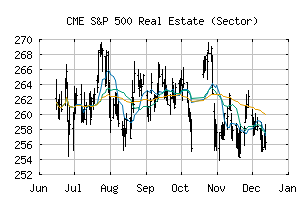
S&P 500 Real Estate (Sector) (CME:SP500-60)
Sidelines Mode (-55) - SP500-60 is moving in a sideways pattern and is unable to gain momentum in either direction. Beware of choppy movement and consider a sidelines position until a stronger trend is identified.
Is it time to buy, sell, or avoid SP500-60?
MarketClub looks at technical strength and momentum to determine if the timing is right for SP500-60.
Learn more about the Trade Triangles and how we make technical analysis as easy as buy and sell.
|
|||||||||||||||
|
|||||||||||||||
MarketClub’s Trade Triangles for SP500-60
![]() The long-term trend has been DOWN since Apr 12th, 2024 at 232.83
The long-term trend has been DOWN since Apr 12th, 2024 at 232.83
![]() The intermediate-term trend has been DOWN since Mar 26th, 2024 at 241.02
The intermediate-term trend has been DOWN since Mar 26th, 2024 at 241.02
![]() The short-term trend has been UP since May 3rd, 2024 at 230.97
The short-term trend has been UP since May 3rd, 2024 at 230.97
Smart Scan Analysis for SP500-60
Based on our trend formula, SP500-60 is rated as a -55 on a scale from -100 (Strong Downtrend) to +100 (Strong Uptrend).
| Open | High | Low | Price | Change |
|---|---|---|---|---|
| 234.14 | 235.33 | 231.42 | 232.06 | +1.89 |
| Prev. Close | Volume | Bid | Ask | Time |
| 232.06 | 83303978 | 2024-05-03 16:20:09 |
| 52wk High | 217.53 | 52wk High Date | 2017-12-06 |
| 52wk Low | 180.54 | 52wk Low Date | 2018-02-09 |