Index Trend Analysis Report
Prepared for you on Thursday, April 18, 2024.
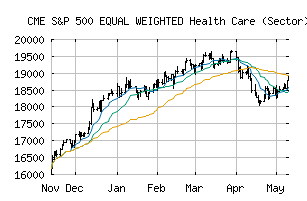
S&P 500 EQUAL WEIGHTED Health Care (Sector) (CME:SP500EW-35)
Long-Term Downtrend (-90) - SP500EW-35 is in a strong downtrend that is likely to continue. While SP500EW-35 is showing intraday strength, it remains in the confines of a bearish trend. Traders should use caution and set stops.
Is it time to buy, sell, or avoid SP500EW-35?
MarketClub looks at technical strength and momentum to determine if the timing is right for SP500EW-35.
Learn more about the Trade Triangles and how we make technical analysis as easy as buy and sell.
|
|||||||||||||||
|
|||||||||||||||
MarketClub’s Trade Triangles for SP500EW-35
![]() The long-term trend has been DOWN since Apr 17th, 2024 at 18216.48
The long-term trend has been DOWN since Apr 17th, 2024 at 18216.48
![]() The intermediate-term trend has been DOWN since Apr 2nd, 2024 at 19146.56
The intermediate-term trend has been DOWN since Apr 2nd, 2024 at 19146.56
![]() The short-term trend has been DOWN since Apr 2nd, 2024 at 19329.10
The short-term trend has been DOWN since Apr 2nd, 2024 at 19329.10
Smart Scan Analysis for SP500EW-35
Based on our trend formula, SP500EW-35 is rated as a -90 on a scale from -100 (Strong Downtrend) to +100 (Strong Uptrend).
| Open | High | Low | Price | Change |
|---|---|---|---|---|
| 18151.58 | 18197.87 | 18046.20 | 18094.46 | -57.12 |
| Prev. Close | Volume | Bid | Ask | Time |
| 18151.58 | 0 | 2024-04-18 16:19:45 |
| 52wk High | 12819.06 | 52wk High Date | 2018-10-01 |
| 52wk Low | 10669.73 | 52wk Low Date | 2018-04-06 |