Index Trend Analysis Report
Prepared for you on Wednesday, April 24, 2024.
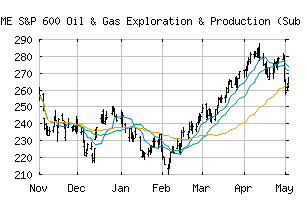
S&P 600 Oil & Gas Exploration & Production (Sub Ind) (CME:SP600-10102020)
Long-Term Uptrend (+90) - SP600-10102020 is in a strong uptrend that is likely to continue. While SP600-10102020 is showing intraday weakness, it remains in the confines of a bullish trend. Traders should use caution and utilize a stop order.
Is it time to buy, sell, or avoid SP600-10102020?
MarketClub looks at technical strength and momentum to determine if the timing is right for SP600-10102020.
Learn more about the Trade Triangles and how we make technical analysis as easy as buy and sell.
|
|||||||||||||||
|
|||||||||||||||
MarketClub’s Trade Triangles for SP600-10102020
![]() The long-term trend has been UP since Mar 1st, 2024 at 250.53
The long-term trend has been UP since Mar 1st, 2024 at 250.53
![]() The intermediate-term trend has been UP since Feb 15th, 2024 at 233.82
The intermediate-term trend has been UP since Feb 15th, 2024 at 233.82
![]() The short-term trend has been UP since Apr 23rd, 2024 at 275.53
The short-term trend has been UP since Apr 23rd, 2024 at 275.53
Smart Scan Analysis for SP600-10102020
Based on our trend formula, SP600-10102020 is rated as a +90 on a scale from -100 (Strong Downtrend) to +100 (Strong Uptrend).
| Open | High | Low | Price | Change |
|---|---|---|---|---|
| 271.77 | 278.21 | 270.18 | 276.34 | +3.77 |
| Prev. Close | Volume | Bid | Ask | Time |
| 276.34 | 10088591 | 2024-04-23 16:19:41 |
| 52wk High | 459.11 | 52wk High Date | 2018-07-10 |
| 52wk Low | 228.28 | 52wk Low Date | 2018-11-28 |