Index Trend Analysis Report
Prepared for you on Friday, April 26, 2024.
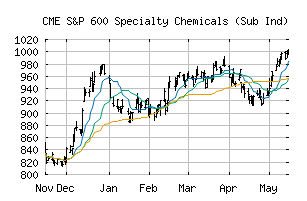
S&P 600 Specialty Chemicals (Sub Ind) (CME:SP600-15101050)
Weak Downtrend (-65) - SP600-15101050 is showing signs of a strengthening downtrend. Monitor SP600-15101050 as it may be building momentum to the downside.
Is it time to buy, sell, or avoid SP600-15101050?
MarketClub looks at technical strength and momentum to determine if the timing is right for SP600-15101050.
Learn more about the Trade Triangles and how we make technical analysis as easy as buy and sell.
|
|||||||||||||||
|
|||||||||||||||
MarketClub’s Trade Triangles for SP600-15101050
![]() The long-term trend has been UP since Dec 14th, 2023 at 935.03
The long-term trend has been UP since Dec 14th, 2023 at 935.03
![]() The intermediate-term trend has been DOWN since Apr 10th, 2024 at 943.12
The intermediate-term trend has been DOWN since Apr 10th, 2024 at 943.12
![]() The short-term trend has been DOWN since Apr 25th, 2024 at 922.59
The short-term trend has been DOWN since Apr 25th, 2024 at 922.59
Smart Scan Analysis for SP600-15101050
Based on our trend formula, SP600-15101050 is rated as a -70 on a scale from -100 (Strong Downtrend) to +100 (Strong Uptrend).
| Open | High | Low | Price | Change |
|---|---|---|---|---|
| 916.09 | 931.60 | 916.09 | 924.64 | +10.86 |
| Prev. Close | Volume | Bid | Ask | Time |
| 913.78 | 1045383 | 2024-04-26 16:20:11 |
| 52wk High | 823.86 | 52wk High Date | 2018-09-21 |
| 52wk Low | 608.73 | 52wk Low Date | 2018-02-09 |