Index Trend Analysis Report
Prepared for you on Thursday, April 25, 2024.
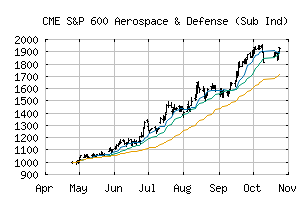
S&P 600 Aerospace & Defense (Sub Ind) (CME:SP600-20101010)
Strong Uptrend (+100) - SP600-20101010 is in a strong uptrend that is likely to continue. With short-term, intermediate, and long-term bullish momentum, SP600-20101010 continues to climb. Traders should protect gains and look for a change in score to suggest a slow down in momentum.
Is it time to buy, sell, or avoid SP600-20101010?
MarketClub looks at technical strength and momentum to determine if the timing is right for SP600-20101010.
Learn more about the Trade Triangles and how we make technical analysis as easy as buy and sell.
|
|||||||||||||||
|
|||||||||||||||
MarketClub’s Trade Triangles for SP600-20101010
![]() The long-term trend has been UP since Dec 1st, 2022 at 588.25
The long-term trend has been UP since Dec 1st, 2022 at 588.25
![]() The intermediate-term trend has been UP since Apr 23rd, 2024 at 877.17
The intermediate-term trend has been UP since Apr 23rd, 2024 at 877.17
![]() The short-term trend has been UP since Apr 22nd, 2024 at 861.11
The short-term trend has been UP since Apr 22nd, 2024 at 861.11
Smart Scan Analysis for SP600-20101010
Based on our trend formula, SP600-20101010 is rated as a +100 on a scale from -100 (Strong Downtrend) to +100 (Strong Uptrend).
| Open | High | Low | Price | Change |
|---|---|---|---|---|
| 888.95 | 893.72 | 874.50 | 886.00 | +2.94 |
| Prev. Close | Volume | Bid | Ask | Time |
| 886.00 | 1957211 | 2024-04-24 17:07:33 |
| 52wk High | 601.2 | 52wk High Date | 2018-09-18 |
| 52wk Low | 403.81 | 52wk Low Date | 2018-02-06 |