Index Trend Analysis Report
Prepared for you on Friday, April 19, 2024.
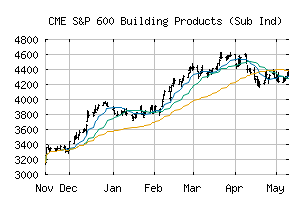
S&P 600 Building Products (Sub Ind) (CME:SP600-20102010)
Weak Downtrend (-65) - SP600-20102010 is showing signs of a strengthening downtrend. Monitor SP600-20102010 as it may be building momentum to the downside.
Is it time to buy, sell, or avoid SP600-20102010?
MarketClub looks at technical strength and momentum to determine if the timing is right for SP600-20102010.
Learn more about the Trade Triangles and how we make technical analysis as easy as buy and sell.
|
|||||||||||||||
|
|||||||||||||||
MarketClub’s Trade Triangles for SP600-20102010
![]() The long-term trend has been UP since Dec 4th, 2023 at 3487.85
The long-term trend has been UP since Dec 4th, 2023 at 3487.85
![]() The intermediate-term trend has been DOWN since Apr 10th, 2024 at 4394.21
The intermediate-term trend has been DOWN since Apr 10th, 2024 at 4394.21
![]() The short-term trend has been DOWN since Apr 10th, 2024 at 4470.27
The short-term trend has been DOWN since Apr 10th, 2024 at 4470.27
Smart Scan Analysis for SP600-20102010
Based on our trend formula, SP600-20102010 is rated as a -70 on a scale from -100 (Strong Downtrend) to +100 (Strong Uptrend).
| Open | High | Low | Price | Change |
|---|---|---|---|---|
| 4174.85 | 4236.97 | 4170.17 | 4187.04 | +0.48 |
| Prev. Close | Volume | Bid | Ask | Time |
| 4186.56 | 1920073 | 2024-04-19 14:13:56 |
| 52wk High | 2116.3 | 52wk High Date | 2018-09-10 |
| 52wk Low | 1425.69 | 52wk Low Date | 2018-10-30 |