Index Trend Analysis Report
Prepared for you on Tuesday, April 16, 2024.
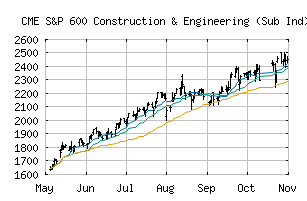
S&P 600 Construction & Engineering (Sub Ind) (CME:SP600-20103010)
Sidelines Mode (+55) - SP600-20103010 is moving in a sideways pattern and is unable to gain momentum in either direction. Beware of choppy movement and consider a sidelines position until a stronger trend is identified.
Is it time to buy, sell, or avoid SP600-20103010?
MarketClub looks at technical strength and momentum to determine if the timing is right for SP600-20103010.
Learn more about the Trade Triangles and how we make technical analysis as easy as buy and sell.
|
|||||||||||||||
|
|||||||||||||||
MarketClub’s Trade Triangles for SP600-20103010
![]() The long-term trend has been UP since Nov 22nd, 2023 at 1235.62
The long-term trend has been UP since Nov 22nd, 2023 at 1235.62
![]() The intermediate-term trend has been DOWN since Apr 15th, 2024 at 1473.29
The intermediate-term trend has been DOWN since Apr 15th, 2024 at 1473.29
![]() The short-term trend has been UP since Apr 15th, 2024 at 1504.99
The short-term trend has been UP since Apr 15th, 2024 at 1504.99
Smart Scan Analysis for SP600-20103010
Based on our trend formula, SP600-20103010 is rated as a +55 on a scale from -100 (Strong Downtrend) to +100 (Strong Uptrend).
| Open | High | Low | Price | Change |
|---|---|---|---|---|
| 1456.85 | 1461.51 | 1435.42 | 1457.07 | -8.21 |
| Prev. Close | Volume | Bid | Ask | Time |
| 1465.28 | 284801 | 2024-04-16 12:50:41 |
| 52wk High | 530.99 | 52wk High Date | 2018-07-27 |
| 52wk Low | 392.8 | 52wk Low Date | 2018-04-02 |