Index Trend Analysis Report
Prepared for you on Wednesday, April 24, 2024.
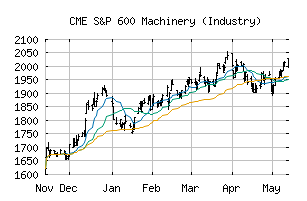
S&P 600 Machinery (Industry) (CME:SP600-201060)
Sidelines Mode (-55) - SP600-201060 is moving in a sideways pattern and is unable to gain momentum in either direction. Beware of choppy movement and consider a sidelines position until a stronger trend is identified.
Is it time to buy, sell, or avoid SP600-201060?
MarketClub looks at technical strength and momentum to determine if the timing is right for SP600-201060.
Learn more about the Trade Triangles and how we make technical analysis as easy as buy and sell.
|
|||||||||||||||
|
|||||||||||||||
MarketClub’s Trade Triangles for SP600-201060
![]() The long-term trend has been UP since Dec 13th, 2023 at 1764.12
The long-term trend has been UP since Dec 13th, 2023 at 1764.12
![]() The intermediate-term trend has been DOWN since Apr 15th, 2024 at 1932.74
The intermediate-term trend has been DOWN since Apr 15th, 2024 at 1932.74
![]() The short-term trend has been UP since Apr 22nd, 2024 at 1937.22
The short-term trend has been UP since Apr 22nd, 2024 at 1937.22
Smart Scan Analysis for SP600-201060
Based on our trend formula, SP600-201060 is rated as a -55 on a scale from -100 (Strong Downtrend) to +100 (Strong Uptrend).
| Open | High | Low | Price | Change |
|---|---|---|---|---|
| 1968.64 | 1981.91 | 1957.14 | 1961.97 | -11.41 |
| Prev. Close | Volume | Bid | Ask | Time |
| 1973.38 | 2891312 | 2024-04-24 13:27:11 |
| 52wk High | 1340.69 | 52wk High Date | 2018-09-21 |
| 52wk Low | 1047.26 | 52wk Low Date | 2018-10-29 |