Index Trend Analysis Report
Prepared for you on Thursday, April 25, 2024.
S&P 600 Agricultural & Farm Machinery (Sub Ind) (CME:SP600-20106015)
Sidelines Mode (+55) - SP600-20106015 is moving in a sideways pattern and is unable to gain momentum in either direction. Beware of choppy movement and consider a sidelines position until a stronger trend is identified.
Is it time to buy, sell, or avoid SP600-20106015?
MarketClub looks at technical strength and momentum to determine if the timing is right for SP600-20106015.
Learn more about the Trade Triangles and how we make technical analysis as easy as buy and sell.
|
|||||||||||||||
|
|||||||||||||||
MarketClub’s Trade Triangles for SP600-20106015
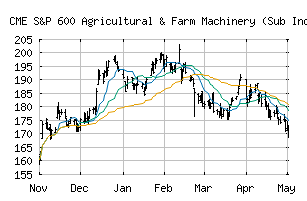
![]() The long-term trend has been UP since Nov 6th, 2023 at 174.73
The long-term trend has been UP since Nov 6th, 2023 at 174.73
![]() The intermediate-term trend has been DOWN since Apr 16th, 2024 at 180.22
The intermediate-term trend has been DOWN since Apr 16th, 2024 at 180.22
![]() The short-term trend has been UP since Apr 23rd, 2024 at 179.18
The short-term trend has been UP since Apr 23rd, 2024 at 179.18
Smart Scan Analysis for SP600-20106015
Based on our trend formula, SP600-20106015 is rated as a +55 on a scale from -100 (Strong Downtrend) to +100 (Strong Uptrend).
| Open | High | Low | Price | Change |
|---|---|---|---|---|
| 178.27 | 179.81 | 175.72 | 177.59 | -1.61 |
| Prev. Close | Volume | Bid | Ask | Time |
| 177.59 | 452462 | 2024-04-24 17:07:33 |
| 52wk High | 145.98 | 52wk High Date | 2018-01-16 |
| 52wk Low | 106.16 | 52wk Low Date | 2018-10-26 |