Index Trend Analysis Report
Prepared for you on Thursday, April 18, 2024.
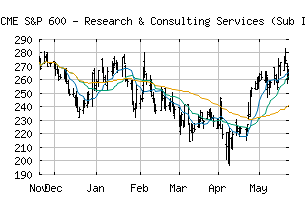
S&P 600 - Research & Consulting Services (Sub Ind) (CME:SP600-20202020)
Strong Downtrend (-100) - SP600-20202020 is in a strong downtrend that is likely to continue. With short-term, intermediate, and long-term bearish momentum, SP600-20202020 continues to fall. Traders should use caution and set stops.
Is it time to buy, sell, or avoid SP600-20202020?
MarketClub looks at technical strength and momentum to determine if the timing is right for SP600-20202020.
Learn more about the Trade Triangles and how we make technical analysis as easy as buy and sell.
|
|||||||||||||||
|
|||||||||||||||
MarketClub’s Trade Triangles for SP600-20202020
![]() The long-term trend has been DOWN since Mar 5th, 2024 at 320.93
The long-term trend has been DOWN since Mar 5th, 2024 at 320.93
![]() The intermediate-term trend has been DOWN since Jan 5th, 2024 at 340.83
The intermediate-term trend has been DOWN since Jan 5th, 2024 at 340.83
![]() The short-term trend has been DOWN since Apr 12th, 2024 at 302.34
The short-term trend has been DOWN since Apr 12th, 2024 at 302.34
Smart Scan Analysis for SP600-20202020
Based on our trend formula, SP600-20202020 is rated as a -100 on a scale from -100 (Strong Downtrend) to +100 (Strong Uptrend).
| Open | High | Low | Price | Change |
|---|---|---|---|---|
| 288.59 | 289.73 | 284.70 | 285.02 | -3.19 |
| Prev. Close | Volume | Bid | Ask | Time |
| 288.21 | 482239 | 2024-04-18 16:19:41 |
| 52wk High | 215.29 | 52wk High Date | 2018-08-14 |
| 52wk Low | 138.47 | 52wk Low Date | 2018-02-09 |