Index Trend Analysis Report
Prepared for you on Friday, April 26, 2024.
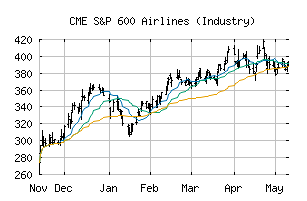
S&P 600 Airlines (Industry) (CME:SP600-203020)
Weak Uptrend (+65) - SP600-203020 is showing signs of weakening momentum to the upside. Monitor SP600-203020 as it may be in the beginning stages of a reversal.
Is it time to buy, sell, or avoid SP600-203020?
MarketClub looks at technical strength and momentum to determine if the timing is right for SP600-203020.
Learn more about the Trade Triangles and how we make technical analysis as easy as buy and sell.
|
|||||||||||||||
|
|||||||||||||||
MarketClub’s Trade Triangles for SP600-203020
![]() The long-term trend has been UP since Dec 13th, 2023 at 347.21
The long-term trend has been UP since Dec 13th, 2023 at 347.21
![]() The intermediate-term trend has been UP since Apr 18th, 2024 at 412.92
The intermediate-term trend has been UP since Apr 18th, 2024 at 412.92
![]() The short-term trend has been DOWN since Apr 23rd, 2024 at 397.05
The short-term trend has been DOWN since Apr 23rd, 2024 at 397.05
Smart Scan Analysis for SP600-203020
Based on our trend formula, SP600-203020 is rated as a +65 on a scale from -100 (Strong Downtrend) to +100 (Strong Uptrend).
| Open | High | Low | Price | Change |
|---|---|---|---|---|
| 385.04 | 394.30 | 379.88 | 392.60 | +0.97 |
| Prev. Close | Volume | Bid | Ask | Time |
| 392.60 | 24054690 | 2024-04-25 16:19:56 |
| 52wk High | 696.42 | 52wk High Date | 2018-08-21 |
| 52wk Low | 516.03 | 52wk Low Date | 2018-10-26 |