Index Trend Analysis Report
Prepared for you on Wednesday, April 24, 2024.
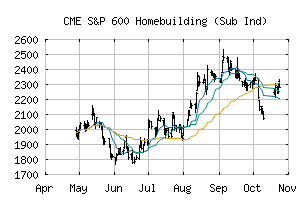
S&P 600 Homebuilding (Sub Ind) (CME:SP600-25201030)
Sidelines Mode (+55) - SP600-25201030 is moving in a sideways pattern and is unable to gain momentum in either direction. Beware of choppy movement and consider a sidelines position until a stronger trend is identified.
Is it time to buy, sell, or avoid SP600-25201030?
MarketClub looks at technical strength and momentum to determine if the timing is right for SP600-25201030.
Learn more about the Trade Triangles and how we make technical analysis as easy as buy and sell.
|
|||||||||||||||
|
|||||||||||||||
MarketClub’s Trade Triangles for SP600-25201030
![]() The long-term trend has been UP since Dec 1st, 2023 at 1934.96
The long-term trend has been UP since Dec 1st, 2023 at 1934.96
![]() The intermediate-term trend has been DOWN since Apr 10th, 2024 at 2295.23
The intermediate-term trend has been DOWN since Apr 10th, 2024 at 2295.23
![]() The short-term trend has been UP since Apr 23rd, 2024 at 2247.18
The short-term trend has been UP since Apr 23rd, 2024 at 2247.18
Smart Scan Analysis for SP600-25201030
Based on our trend formula, SP600-25201030 is rated as a +55 on a scale from -100 (Strong Downtrend) to +100 (Strong Uptrend).
| Open | High | Low | Price | Change |
|---|---|---|---|---|
| 2237.22 | 2331.67 | 2228.07 | 2328.51 | +106.43 |
| Prev. Close | Volume | Bid | Ask | Time |
| 2328.51 | 2822133 | 2024-04-23 16:19:26 |
| 52wk High | 884.24 | 52wk High Date | 2018-01-09 |
| 52wk Low | 543.5 | 52wk Low Date | 2018-10-23 |