Index Trend Analysis Report
Prepared for you on Tuesday, April 16, 2024.
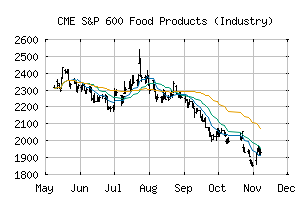
S&P 600 Food Products (Industry) (CME:SP600-302020)
Long-Term Downtrend (-90) - SP600-302020 is in a strong downtrend that is likely to continue. While SP600-302020 is showing intraday strength, it remains in the confines of a bearish trend. Traders should use caution and set stops.
Is it time to buy, sell, or avoid SP600-302020?
MarketClub looks at technical strength and momentum to determine if the timing is right for SP600-302020.
Learn more about the Trade Triangles and how we make technical analysis as easy as buy and sell.
|
|||||||||||||||
|
|||||||||||||||
MarketClub’s Trade Triangles for SP600-302020
![]() The long-term trend has been DOWN since Apr 12th, 2024 at 2373.01
The long-term trend has been DOWN since Apr 12th, 2024 at 2373.01
![]() The intermediate-term trend has been DOWN since Apr 3rd, 2024 at 2414.17
The intermediate-term trend has been DOWN since Apr 3rd, 2024 at 2414.17
![]() The short-term trend has been DOWN since Apr 10th, 2024 at 2429.35
The short-term trend has been DOWN since Apr 10th, 2024 at 2429.35
Smart Scan Analysis for SP600-302020
Based on our trend formula, SP600-302020 is rated as a -90 on a scale from -100 (Strong Downtrend) to +100 (Strong Uptrend).
| Open | High | Low | Price | Change |
|---|---|---|---|---|
| 2378.75 | 2402.52 | 2368.50 | 2392.19 | +15.70 |
| Prev. Close | Volume | Bid | Ask | Time |
| 2376.49 | 4393084 | 2024-04-16 14:25:41 |
| 52wk High | 2580.68 | 52wk High Date | 2018-06-27 |
| 52wk Low | 2093.68 | 52wk Low Date | 2018-05-03 |