Index Trend Analysis Report
Prepared for you on Friday, May 10, 2024.
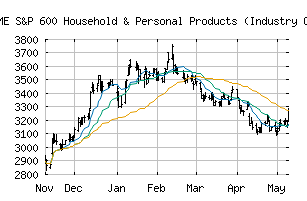
S&P 600 Household & Personal Products (Industry Group) (CME:SP600-3030)
Bull Market Weakness (+75) - SP600-3030 is showing signs of short-term weakness, but still remains in the confines of a long-term uptrend. Keep an eye on SP600-3030 as it may be in the beginning stages of a reversal.
Is it time to buy, sell, or avoid SP600-3030?
MarketClub looks at technical strength and momentum to determine if the timing is right for SP600-3030.
Learn more about the Trade Triangles and how we make technical analysis as easy as buy and sell.
|
|||||||||||||||
|
|||||||||||||||
MarketClub’s Trade Triangles for SP600-3030
![]() The long-term trend has been DOWN since Apr 2nd, 2024 at 3297.98
The long-term trend has been DOWN since Apr 2nd, 2024 at 3297.98
![]() The intermediate-term trend has been UP since May 9th, 2024 at 3245.35
The intermediate-term trend has been UP since May 9th, 2024 at 3245.35
![]() The short-term trend has been UP since May 9th, 2024 at 3211.50
The short-term trend has been UP since May 9th, 2024 at 3211.50
Smart Scan Analysis for SP600-3030
Based on our trend formula, SP600-3030 is rated as a +70 on a scale from -100 (Strong Downtrend) to +100 (Strong Uptrend).
| Open | High | Low | Price | Change |
|---|---|---|---|---|
| 3273.72 | 3310.56 | 3259.25 | 3308.73 | +24.39 |
| Prev. Close | Volume | Bid | Ask | Time |
| 3284.34 | 2878186 | 2024-05-10 16:19:41 |
| 52wk High | 2102.98 | 52wk High Date | 2018-09-13 |
| 52wk Low | 1344.74 | 52wk Low Date | 2018-02-06 |