Index Trend Analysis Report
Prepared for you on Thursday, April 25, 2024.
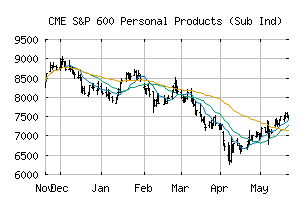
S&P 600 Personal Products (Sub Ind) (CME:SP600-30302010)
Long-Term Downtrend (-90) - SP600-30302010 is in a strong downtrend that is likely to continue. While SP600-30302010 is showing intraday strength, it remains in the confines of a bearish trend. Traders should use caution and set stops.
Is it time to buy, sell, or avoid SP600-30302010?
MarketClub looks at technical strength and momentum to determine if the timing is right for SP600-30302010.
Learn more about the Trade Triangles and how we make technical analysis as easy as buy and sell.
|
|||||||||||||||
|
|||||||||||||||
MarketClub’s Trade Triangles for SP600-30302010
![]() The long-term trend has been DOWN since Apr 3rd, 2024 at 9500.42
The long-term trend has been DOWN since Apr 3rd, 2024 at 9500.42
![]() The intermediate-term trend has been DOWN since Feb 20th, 2024 at 10464.11
The intermediate-term trend has been DOWN since Feb 20th, 2024 at 10464.11
![]() The short-term trend has been DOWN since Apr 25th, 2024 at 9208.98
The short-term trend has been DOWN since Apr 25th, 2024 at 9208.98
Smart Scan Analysis for SP600-30302010
Based on our trend formula, SP600-30302010 is rated as a -90 on a scale from -100 (Strong Downtrend) to +100 (Strong Uptrend).
| Open | High | Low | Price | Change |
|---|---|---|---|---|
| 9324.14 | 9330.26 | 8915.99 | 8956.77 | -460.76 |
| Prev. Close | Volume | Bid | Ask | Time |
| 9417.53 | 1484111 | 2024-04-25 16:19:56 |
| 52wk High | 5291.09 | 52wk High Date | 2018-09-13 |
| 52wk Low | 2656.54 | 52wk Low Date | 2018-03-01 |