Index Trend Analysis Report
Prepared for you on Wednesday, April 24, 2024.
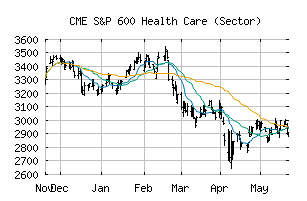
S&P 600 Health Care (Sector) (CME:SP600-35)
Countertrend Down (-85) - SP600-35 is showing short-term strength. However, look for the longer-term bearish trend to resume. As always, continue to monitor the trend score and set stops.
Is it time to buy, sell, or avoid SP600-35?
MarketClub looks at technical strength and momentum to determine if the timing is right for SP600-35.
Learn more about the Trade Triangles and how we make technical analysis as easy as buy and sell.
|
|||||||||||||||
|
|||||||||||||||
MarketClub’s Trade Triangles for SP600-35
![]() The long-term trend has been DOWN since Apr 16th, 2024 at 2939.03
The long-term trend has been DOWN since Apr 16th, 2024 at 2939.03
![]() The intermediate-term trend has been DOWN since Apr 11th, 2024 at 3030.87
The intermediate-term trend has been DOWN since Apr 11th, 2024 at 3030.87
![]() The short-term trend has been UP since Apr 23rd, 2024 at 2944.54
The short-term trend has been UP since Apr 23rd, 2024 at 2944.54
Smart Scan Analysis for SP600-35
Based on our trend formula, SP600-35 is rated as a -85 on a scale from -100 (Strong Downtrend) to +100 (Strong Uptrend).
| Open | High | Low | Price | Change |
|---|---|---|---|---|
| 2930.48 | 2991.80 | 2922.36 | 2977.04 | +56.23 |
| Prev. Close | Volume | Bid | Ask | Time |
| 2977.04 | 37799763 | 2024-04-23 16:19:39 |
| 52wk High | 3476.23 | 52wk High Date | 2018-08-31 |
| 52wk Low | 2260.72 | 52wk Low Date | 2017-12-06 |