Index Trend Analysis Report
Prepared for you on Friday, April 19, 2024.
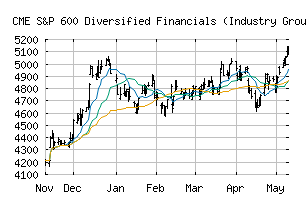
S&P 600 Diversified Financials (Industry Group) (CME:SP600-4020)
Weak Downtrend (-65) - SP600-4020 is showing signs of a strengthening downtrend. Monitor SP600-4020 as it may be building momentum to the downside.
Is it time to buy, sell, or avoid SP600-4020?
MarketClub looks at technical strength and momentum to determine if the timing is right for SP600-4020.
Learn more about the Trade Triangles and how we make technical analysis as easy as buy and sell.
|
|||||||||||||||
|
|||||||||||||||
MarketClub’s Trade Triangles for SP600-4020
![]() The long-term trend has been UP since Dec 13th, 2023 at 4727.07
The long-term trend has been UP since Dec 13th, 2023 at 4727.07
![]() The intermediate-term trend has been DOWN since Apr 12th, 2024 at 4752.32
The intermediate-term trend has been DOWN since Apr 12th, 2024 at 4752.32
![]() The short-term trend has been DOWN since Apr 2nd, 2024 at 4907.37
The short-term trend has been DOWN since Apr 2nd, 2024 at 4907.37
Smart Scan Analysis for SP600-4020
Based on our trend formula, SP600-4020 is rated as a -70 on a scale from -100 (Strong Downtrend) to +100 (Strong Uptrend).
| Open | High | Low | Price | Change |
|---|---|---|---|---|
| 4662.65 | 4723.96 | 4656.76 | 4667.09 | +19.89 |
| Prev. Close | Volume | Bid | Ask | Time |
| 4667.09 | 29399108 | 2024-04-18 16:19:41 |
| 52wk High | 6453.49 | 52wk High Date | 2018-07-24 |
| 52wk Low | 5336.48 | 52wk Low Date | 2017-12-01 |