Index Trend Analysis Report
Prepared for you on Thursday, April 18, 2024.
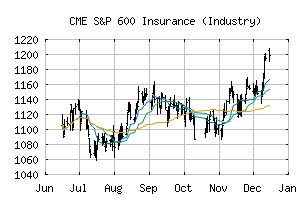
S&P 600 Insurance (Industry) (CME:SP600-403010)
Weak Downtrend (-65) - SP600-403010 is showing signs of a strengthening downtrend. Monitor SP600-403010 as it may be building momentum to the downside.
Is it time to buy, sell, or avoid SP600-403010?
MarketClub looks at technical strength and momentum to determine if the timing is right for SP600-403010.
Learn more about the Trade Triangles and how we make technical analysis as easy as buy and sell.
|
|||||||||||||||
|
|||||||||||||||
MarketClub’s Trade Triangles for SP600-403010
![]() The long-term trend has been UP since Dec 1st, 2023 at 783.16
The long-term trend has been UP since Dec 1st, 2023 at 783.16
![]() The intermediate-term trend has been DOWN since Apr 9th, 2024 at 875.89
The intermediate-term trend has been DOWN since Apr 9th, 2024 at 875.89
![]() The short-term trend has been DOWN since Apr 2nd, 2024 at 896.09
The short-term trend has been DOWN since Apr 2nd, 2024 at 896.09
Smart Scan Analysis for SP600-403010
Based on our trend formula, SP600-403010 is rated as a -70 on a scale from -100 (Strong Downtrend) to +100 (Strong Uptrend).
| Open | High | Low | Price | Change |
|---|---|---|---|---|
| 836.16 | 836.46 | 824.36 | 826.20 | -6.35 |
| Prev. Close | Volume | Bid | Ask | Time |
| 826.20 | 8066891 | 2024-04-17 16:19:26 |
| 52wk High | 930.93 | 52wk High Date | 2018-09-14 |
| 52wk Low | 764.77 | 52wk Low Date | 2018-02-09 |