Index Trend Analysis Report
Prepared for you on Saturday, May 4, 2024.
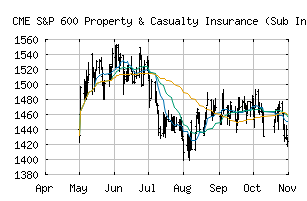
S&P 600 Property & Casualty Insurance (Sub Ind) (CME:SP600-40301040)
Sidelines Mode (-55) - SP600-40301040 is moving in a sideways pattern and is unable to gain momentum in either direction. Beware of choppy movement and consider a sidelines position until a stronger trend is identified.
Is it time to buy, sell, or avoid SP600-40301040?
MarketClub looks at technical strength and momentum to determine if the timing is right for SP600-40301040.
Learn more about the Trade Triangles and how we make technical analysis as easy as buy and sell.
|
|||||||||||||||
|
|||||||||||||||
MarketClub’s Trade Triangles for SP600-40301040
![]() The long-term trend has been UP since Dec 4th, 2023 at 1035.35
The long-term trend has been UP since Dec 4th, 2023 at 1035.35
![]() The intermediate-term trend has been DOWN since Apr 3rd, 2024 at 1208.43
The intermediate-term trend has been DOWN since Apr 3rd, 2024 at 1208.43
![]() The short-term trend has been UP since May 1st, 2024 at 1183.66
The short-term trend has been UP since May 1st, 2024 at 1183.66
Smart Scan Analysis for SP600-40301040
Based on our trend formula, SP600-40301040 is rated as a -55 on a scale from -100 (Strong Downtrend) to +100 (Strong Uptrend).
| Open | High | Low | Price | Change |
|---|---|---|---|---|
| 1187.39 | 1188.52 | 1171.59 | 1171.59 | -8.52 |
| Prev. Close | Volume | Bid | Ask | Time |
| 1171.59 | 4431697 | 2024-05-03 16:20:11 |
| 52wk High | 1091.41 | 52wk High Date | 2018-09-14 |
| 52wk Low | 878.95 | 52wk Low Date | 2018-02-09 |