Index Trend Analysis Report
Prepared for you on Friday, April 26, 2024.
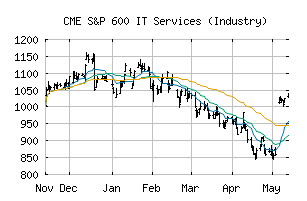
S&P 600 IT Services (Industry) (CME:SP600-451020)
Long-Term Downtrend (-90) - SP600-451020 is in a strong downtrend that is likely to continue. While SP600-451020 is showing intraday strength, it remains in the confines of a bearish trend. Traders should use caution and set stops.
Is it time to buy, sell, or avoid SP600-451020?
MarketClub looks at technical strength and momentum to determine if the timing is right for SP600-451020.
Learn more about the Trade Triangles and how we make technical analysis as easy as buy and sell.
|
|||||||||||||||
|
|||||||||||||||
MarketClub’s Trade Triangles for SP600-451020
![]() The long-term trend has been DOWN since Mar 5th, 2024 at 998.54
The long-term trend has been DOWN since Mar 5th, 2024 at 998.54
![]() The intermediate-term trend has been DOWN since Feb 2nd, 2024 at 1038.77
The intermediate-term trend has been DOWN since Feb 2nd, 2024 at 1038.77
![]() The short-term trend has been DOWN since Apr 25th, 2024 at 869.81
The short-term trend has been DOWN since Apr 25th, 2024 at 869.81
Smart Scan Analysis for SP600-451020
Based on our trend formula, SP600-451020 is rated as a -90 on a scale from -100 (Strong Downtrend) to +100 (Strong Uptrend).
| Open | High | Low | Price | Change |
|---|---|---|---|---|
| 875.09 | 878.05 | 855.11 | 859.02 | -7.14 |
| Prev. Close | Volume | Bid | Ask | Time |
| 866.16 | 1712739 | 2024-04-26 17:18:18 |
| 52wk High | 933.81 | 52wk High Date | 2018-08-27 |
| 52wk Low | 711.91 | 52wk Low Date | 2017-12-01 |