Index Trend Analysis Report
Prepared for you on Friday, April 26, 2024.
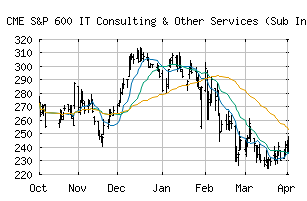
S&P 600 IT Consulting & Other Services (Sub Ind) (CME:SP600-45102010)
Long-Term Downtrend (-90) - SP600-45102010 is in a strong downtrend that is likely to continue. While SP600-45102010 is showing intraday strength, it remains in the confines of a bearish trend. Traders should use caution and set stops.
Is it time to buy, sell, or avoid SP600-45102010?
MarketClub looks at technical strength and momentum to determine if the timing is right for SP600-45102010.
Learn more about the Trade Triangles and how we make technical analysis as easy as buy and sell.
|
|||||||||||||||
|
|||||||||||||||
MarketClub’s Trade Triangles for SP600-45102010
![]() The long-term trend has been DOWN since Mar 5th, 2024 at 441.67
The long-term trend has been DOWN since Mar 5th, 2024 at 441.67
![]() The intermediate-term trend has been DOWN since Feb 2nd, 2024 at 459.46
The intermediate-term trend has been DOWN since Feb 2nd, 2024 at 459.46
![]() The short-term trend has been DOWN since Apr 25th, 2024 at 384.73
The short-term trend has been DOWN since Apr 25th, 2024 at 384.73
Smart Scan Analysis for SP600-45102010
Based on our trend formula, SP600-45102010 is rated as a -90 on a scale from -100 (Strong Downtrend) to +100 (Strong Uptrend).
| Open | High | Low | Price | Change |
|---|---|---|---|---|
| 391.79 | 392.80 | 381.92 | 383.12 | -14.98 |
| Prev. Close | Volume | Bid | Ask | Time |
| 383.12 | 1898876 | 2024-04-25 16:19:56 |
| 52wk High | 570.18 | 52wk High Date | 2018-09-14 |
| 52wk Low | 388.97 | 52wk Low Date | 2017-12-01 |