Index Trend Analysis Report
Prepared for you on Thursday, April 25, 2024.
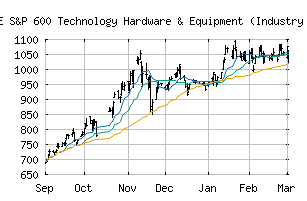
S&P 600 Technology Hardware & Equipment (Industry Group) (CME:SP600-4520)
Countertrend Down (-85) - SP600-4520 is showing short-term strength. However, look for the longer-term bearish trend to resume. As always, continue to monitor the trend score and set stops.
Is it time to buy, sell, or avoid SP600-4520?
MarketClub looks at technical strength and momentum to determine if the timing is right for SP600-4520.
Learn more about the Trade Triangles and how we make technical analysis as easy as buy and sell.
|
|||||||||||||||
|
|||||||||||||||
MarketClub’s Trade Triangles for SP600-4520
![]() The long-term trend has been DOWN since Apr 15th, 2024 at 528.22
The long-term trend has been DOWN since Apr 15th, 2024 at 528.22
![]() The intermediate-term trend has been DOWN since Mar 18th, 2024 at 545.95
The intermediate-term trend has been DOWN since Mar 18th, 2024 at 545.95
![]() The short-term trend has been UP since Apr 22nd, 2024 at 529.90
The short-term trend has been UP since Apr 22nd, 2024 at 529.90
Smart Scan Analysis for SP600-4520
Based on our trend formula, SP600-4520 is rated as a -85 on a scale from -100 (Strong Downtrend) to +100 (Strong Uptrend).
| Open | High | Low | Price | Change |
|---|---|---|---|---|
| 537.03 | 540.91 | 533.45 | 536.07 | -2.36 |
| Prev. Close | Volume | Bid | Ask | Time |
| 536.07 | 18111816 | 2024-04-24 17:07:33 |
| 52wk High | 430.17 | 52wk High Date | 2018-08-27 |
| 52wk Low | 340.77 | 52wk Low Date | 2018-10-29 |