Index Trend Analysis Report
Prepared for you on Tuesday, April 23, 2024.
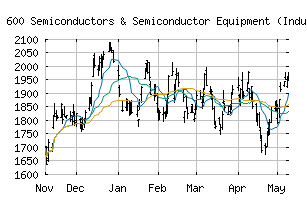
S&P 600 Semiconductors & Semiconductor Equipment (Industry Group) (CME:SP600-4530)
Long-Term Downtrend (-90) - SP600-4530 is in a strong downtrend that is likely to continue. While SP600-4530 is showing intraday strength, it remains in the confines of a bearish trend. Traders should use caution and set stops.
Is it time to buy, sell, or avoid SP600-4530?
MarketClub looks at technical strength and momentum to determine if the timing is right for SP600-4530.
Learn more about the Trade Triangles and how we make technical analysis as easy as buy and sell.
|
|||||||||||||||
|
|||||||||||||||
MarketClub’s Trade Triangles for SP600-4530
![]() The long-term trend has been DOWN since Mar 19th, 2024 at 1758.31
The long-term trend has been DOWN since Mar 19th, 2024 at 1758.31
![]() The intermediate-term trend has been DOWN since Apr 15th, 2024 at 1821.64
The intermediate-term trend has been DOWN since Apr 15th, 2024 at 1821.64
![]() The short-term trend has been DOWN since Apr 10th, 2024 at 1883.31
The short-term trend has been DOWN since Apr 10th, 2024 at 1883.31
Smart Scan Analysis for SP600-4530
Based on our trend formula, SP600-4530 is rated as a -90 on a scale from -100 (Strong Downtrend) to +100 (Strong Uptrend).
| Open | High | Low | Price | Change |
|---|---|---|---|---|
| 1703.57 | 1748.84 | 1703.09 | 1745.27 | +46.79 |
| Prev. Close | Volume | Bid | Ask | Time |
| 1698.48 | 3325361 | 2024-04-23 11:38:41 |
| 52wk High | 822.76 | 52wk High Date | 2018-06-06 |
| 52wk Low | 590.08 | 52wk Low Date | 2018-10-26 |