Index Trend Analysis Report
Prepared for you on Wednesday, April 17, 2024.
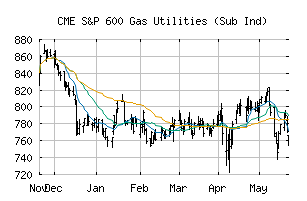
S&P 600 Gas Utilities (Sub Ind) (CME:SP600-55102010)
Strong Downtrend (-100) - SP600-55102010 is in a strong downtrend that is likely to continue. With short-term, intermediate, and long-term bearish momentum, SP600-55102010 continues to fall. Traders should use caution and set stops.
Is it time to buy, sell, or avoid SP600-55102010?
MarketClub looks at technical strength and momentum to determine if the timing is right for SP600-55102010.
Learn more about the Trade Triangles and how we make technical analysis as easy as buy and sell.
|
|||||||||||||||
|
|||||||||||||||
MarketClub’s Trade Triangles for SP600-55102010
![]() The long-term trend has been DOWN since Mar 23rd, 2023 at 764.17
The long-term trend has been DOWN since Mar 23rd, 2023 at 764.17
![]() The intermediate-term trend has been DOWN since Apr 10th, 2024 at 632.09
The intermediate-term trend has been DOWN since Apr 10th, 2024 at 632.09
![]() The short-term trend has been DOWN since Apr 3rd, 2024 at 647.99
The short-term trend has been DOWN since Apr 3rd, 2024 at 647.99
Smart Scan Analysis for SP600-55102010
Based on our trend formula, SP600-55102010 is rated as a -100 on a scale from -100 (Strong Downtrend) to +100 (Strong Uptrend).
| Open | High | Low | Price | Change |
|---|---|---|---|---|
| 625.58 | 631.41 | 624.96 | 627.46 | +6.74 |
| Prev. Close | Volume | Bid | Ask | Time |
| 620.72 | 282375 | 2024-04-17 16:19:26 |
| 52wk High | 881.76 | 52wk High Date | 2017-12-04 |
| 52wk Low | 660.6 | 52wk Low Date | 2018-02-06 |