Index Trend Analysis Report
Prepared for you on Wednesday, May 8, 2024.
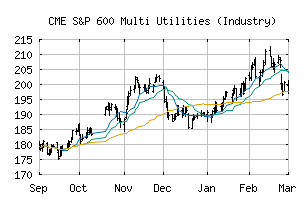
S&P 600 Multi Utilities (Industry) (CME:SP600-551030)
Long-Term Uptrend (+90) - SP600-551030 is in a strong uptrend that is likely to continue. While SP600-551030 is showing intraday weakness, it remains in the confines of a bullish trend. Traders should use caution and utilize a stop order.
Is it time to buy, sell, or avoid SP600-551030?
MarketClub looks at technical strength and momentum to determine if the timing is right for SP600-551030.
Learn more about the Trade Triangles and how we make technical analysis as easy as buy and sell.
|
|||||||||||||||
|
|||||||||||||||
MarketClub’s Trade Triangles for SP600-551030
![]() The long-term trend has been UP since May 1st, 2024 at 181.72
The long-term trend has been UP since May 1st, 2024 at 181.72
![]() The intermediate-term trend has been UP since Apr 24th, 2024 at 180.61
The intermediate-term trend has been UP since Apr 24th, 2024 at 180.61
![]() The short-term trend has been UP since May 1st, 2024 at 181.72
The short-term trend has been UP since May 1st, 2024 at 181.72
Smart Scan Analysis for SP600-551030
Based on our trend formula, SP600-551030 is rated as a +90 on a scale from -100 (Strong Downtrend) to +100 (Strong Uptrend).
| Open | High | Low | Price | Change |
|---|---|---|---|---|
| 189.29 | 190.80 | 188.72 | 189.93 | -0.42 |
| Prev. Close | Volume | Bid | Ask | Time |
| 190.35 | 411538 | 2024-05-08 17:00:40 |
| 52wk High | 259.37 | 52wk High Date | 2018-07-02 |
| 52wk Low | 233.39 | 52wk Low Date | 2018-03-07 |