Index Trend Analysis Report
Prepared for you on Thursday, April 25, 2024.
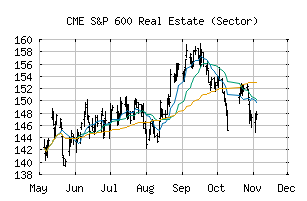
S&P 600 Real Estate (Sector) (CME:SP600-60)
Weak Downtrend (-65) - SP600-60 is showing signs of a strengthening downtrend. Monitor SP600-60 as it may be building momentum to the downside.
Is it time to buy, sell, or avoid SP600-60?
MarketClub looks at technical strength and momentum to determine if the timing is right for SP600-60.
Learn more about the Trade Triangles and how we make technical analysis as easy as buy and sell.
|
|||||||||||||||
|
|||||||||||||||
MarketClub’s Trade Triangles for SP600-60
![]() The long-term trend has been DOWN since Apr 16th, 2024 at 141.67
The long-term trend has been DOWN since Apr 16th, 2024 at 141.67
![]() The intermediate-term trend has been DOWN since Apr 5th, 2024 at 144.54
The intermediate-term trend has been DOWN since Apr 5th, 2024 at 144.54
![]() The short-term trend has been UP since Apr 19th, 2024 at 142.30
The short-term trend has been UP since Apr 19th, 2024 at 142.30
Smart Scan Analysis for SP600-60
Based on our trend formula, SP600-60 is rated as a -65 on a scale from -100 (Strong Downtrend) to +100 (Strong Uptrend).
| Open | High | Low | Price | Change |
|---|---|---|---|---|
| 145.70 | 146.22 | 144.98 | 145.84 | -0.65 |
| Prev. Close | Volume | Bid | Ask | Time |
| 145.84 | 64031221 | 2024-04-24 17:07:33 |
| 52wk High | 225.6 | 52wk High Date | 2017-12-06 |
| 52wk Low | 172.73 | 52wk Low Date | 2018-02-12 |